|

美元兌日元價格分析:突破一周三角形導致波動性上升,128.50是關鍵

  • 美元兌日元維持在低位水平,空頭連續第三日占上風
  • 一周前的對稱三角形限制短期波動
  • RSI下降、MACD信號看跌支持空頭刷新數月低點
  • 多頭需要突破六週前的下降趨勢線才能重拾控制權
美元兌日元價格分析:突破一周三角形導致波動性上升,128.50是關鍵

週四亞市美元兌日元徘徊於129.40附近,整理最新跌勢,結束兩日連跌。

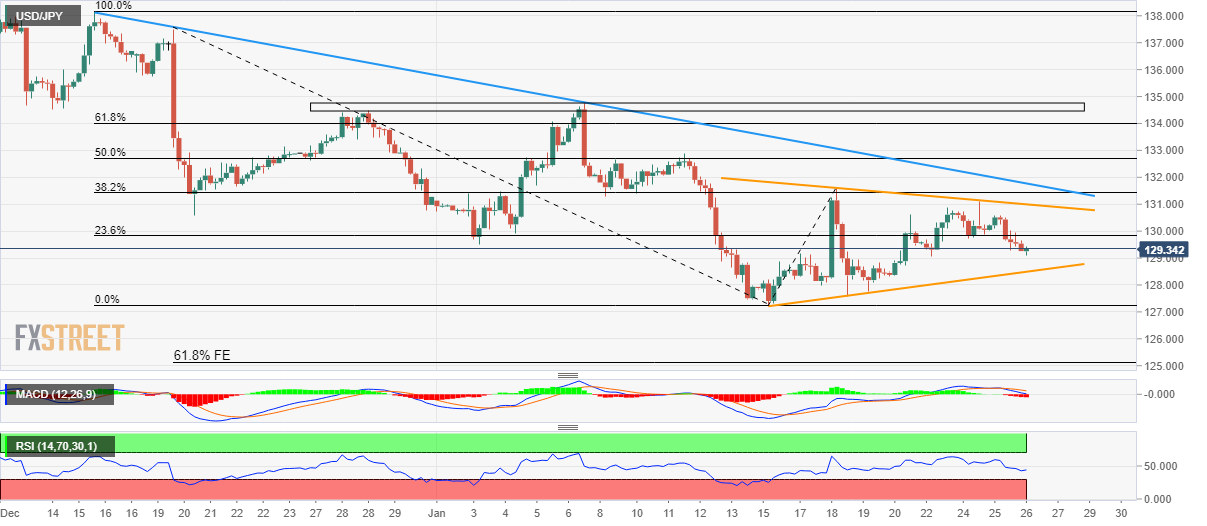
即便如此,該貨幣對小幅下跌,同時位於128.50-131.00之間的一周對稱三角形內。

不過MACD信號看跌且相對強弱指標線下降令美元兌日元空頭充滿希望。自2022年12月中旬以來的下降阻力線也挑戰日元多頭。

應該要注意的是,該貨幣對12月15日至1月16日期間跌勢的50%斐波納契回檔位接近132.70,加上一個月之久的水平阻力區域(位於134.50-75區域附近)將挑戰該貨幣對進一步上漲。

另一方面,美元兌日元必須明顯突破上述三角形的支撐位128.50附近才能說服空頭入場。

之後127.20附近的月度低點以及8個月最低水平可能試探該貨幣對空頭,之後將指引他們指向12月20日至1月18日期間波段的61.8%的斐波納契延展回檔位,位於125.20附近。

總體上,匯價將跌向突破點並暗示後市波動性將上升。

美元兌日元4小時圖
趨勢:料進一步下跌

美元兌日元

總覽
今日最新價129.45
今天日內變化-0.15
今天日內變化%-0.12
今日開盤價129.6
 
趨勢
20日移動均線130.59
50日移動均線134.24
100日移動均線139.73
200日移動均線136.75
 
水平
前一天高點130.58
前一天低點129.27
上周高點131.58
上週低點127.22
上月高點138.18
上月低點130.57
日圖38.2%斐波那契回撤位129.77
日圖61.8%斐波那契回撤位130.08
日圖軸心支撐位1129.05
日圖軸心支撐位2128.5
日圖軸心支撐位3127.73
日圖軸心阻力位1130.37
日圖軸心阻力位2131.13
日圖軸心阻力位3131.68

作者

FXStreet Team

Composed of a group of economic journalists and FX experts, the FXStreet content team produces and oversees all content published on FXStreet. It provides a purely journalistic approach to the Forex market.

更多來自 FXStreet Team

分享:

編輯精選

AUD/USD sits at fresh 10-month lows, nears 0.6700

AUD/USD refreshes ten-month lows below 0.6750 and approaches 0.6700 in Wednesday’s Asian session. Fed rate-hike bets, along with fresh exchange of fire between the US and Iran, underpin the safe-haven US Dollar. Furthermore, the RBA’s dovish tilt weighs on the Aussie and the pair.

USD/JPY defends bids near 159.50 on hawkish BoJ Ueda

USD/JPY is defending bids near 159.50 in the Asian session on Wednesday, holding a three-day losing streak after hawkish commentary from BoJ Governor Ueda supports the Japanese Yen amid looming intervention risks. Meanwhile, escalating Middle East tensions revive US Dollar demand amid hawkish Fed bets, which could limit the pair's downside.


Gold stays deep in red below $3,800; Fed Minutes eyed

Gold sticks to intraday losses below the $3,800 mark in the European session on Wednesday, trading close to its lowest level since September 2025. Following last week’s hot US inflation reports, several Federal Reserve officials adopted a more hawkish tone and signaled further interest-rate hikes. Adding to this, Tuesday’s upbeat US data cemented market bets, which continue to act as a tailwind for the US Dollar, and drive flows away from non-yielding bullion.

Bitcoin stalls as ETF outflows mount ahead of Fed Minutes

Bitcoin stalls near $65,000 on Wednesday as buyers struggle to sustain a recovery from last week’s decline toward $62,000. Weakening institutional demand so far this week from BTC spot Exchange Traded Funds continues to weigh on sentiment.

Nvidia offers up double beat in third quarter

Nvidia (NVDA) shares jumped 3% afterhours as the leading AI chipmaker easily surpassed Wall Street's projections for the third quarter. The semiconductor powerhouse posted adjusted earnings per share of $2.68, 8.5% or $0.21 better than the consensus. Revenue of $115.85 billion clobbered the consensus by $7.1 billion or 6.6%.

Gold isn't being sold for thew reason most people think
Gold (XAU/USD) remains under heavy selling pressure on Monday, hitting its lowest level in 13 months. The precious metal is struggling to recover despite escalating geopolitical tensions in the Middle East, a backdrop that would normally encourage investors to seek protection in safe-haven assets. However, the main driver behind Gold's decline is not the geopolitical uncertainty itself.